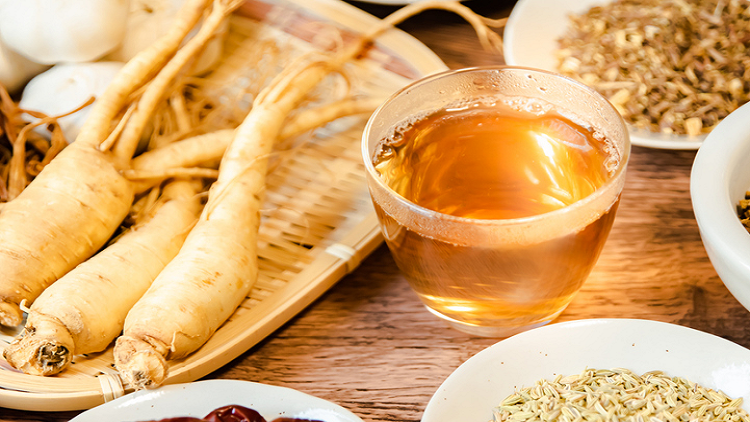
โสมเกาหลี มหัศจรรย์จากธรรมชาติ สุดยอดสมุนไพรเกาหลี
โสมเกาหลี (Korean Ginseng) เป็นสมุนไพรที่มีชื่อเสียงโด่งดังมาอย่างยาวนาน โดยเฉพาะในประเทศเกาหลีใต้… Read More »โสมเกาหลี มหัศจรรย์จากธรรมชาติ สุดยอดสมุนไพรเกาหลี
โสมเกาหลี (Korean Ginseng) เป็นสมุนไพรที่มีชื่อเสียงโด่งดังมาอย่างยาวนาน โดยเฉพาะในประเทศเกาหลีใต้… Read More »โสมเกาหลี มหัศจรรย์จากธรรมชาติ สุดยอดสมุนไพรเกาหลี
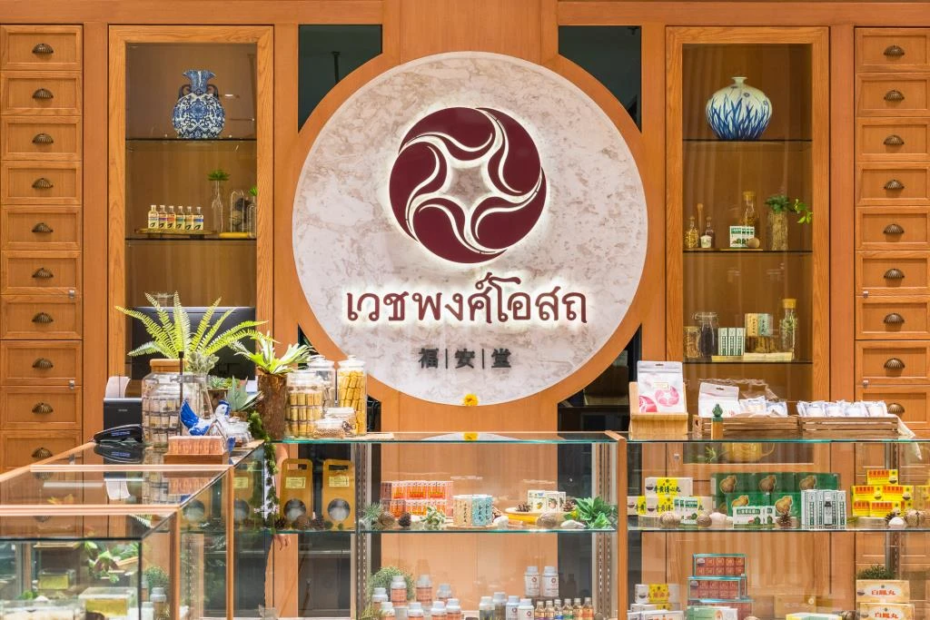
เวชพงศ์โอสถ เป็นแบรนด์สมุนไพรไทย-จีนที่มีความมั่นคงและน่าเชื่อถือมายาวนานกว่า 120 ปี* (ณ… Read More »เวชพงศ์โอสถ ตำนานสามรุ่นแห่งสมุนไพรไทย-จีน
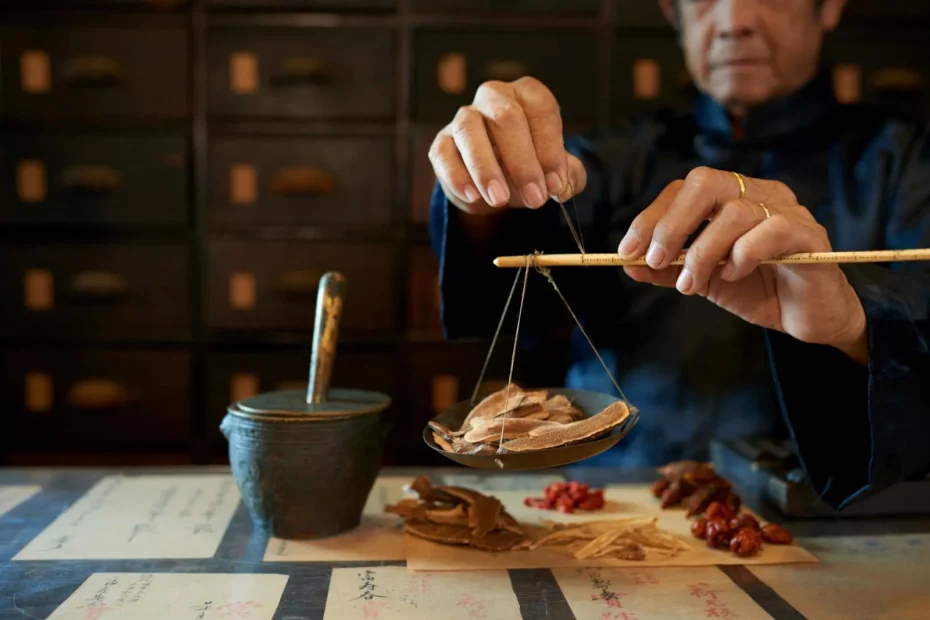
สมุนไพรจีน (Chinese herb) ถือว่าเป็นรากฐานของแพทย์แผนจีน ตามความคิดเห็นของผู้เขียน… Read More »เสน่ห์อันยั่งยืนของสมุนไพรจีน
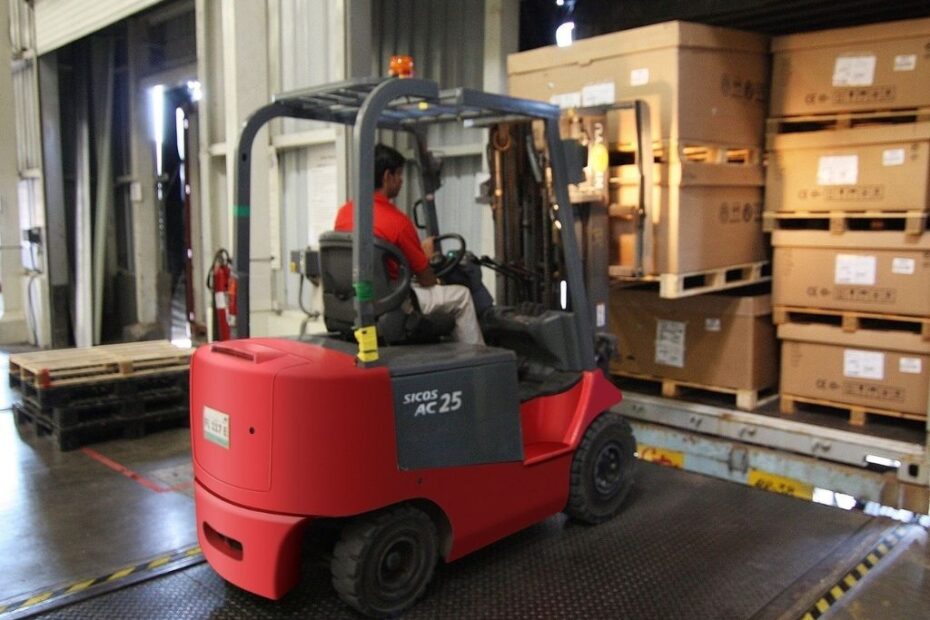
การละเลยการซ่อมบำรุงรักษารถโฟล์คลิฟท์รายวันอาจนำไปสู่การเสียหายที่มีราคาแพง อันตรายต่อความปลอดภัย และประสิทธิภาพที่ลดลง ด้านล่างคือเหตุผลว่าทำไมการซ่อมบำรุงรักษารถโฟล์คลิฟท์ประจำวันจึงมีความสำคัญ: เหตุผลที่คุณควรซ่อมบำรุงรถโฟล์คลิฟท์… Read More »ทำไมการบำรุงรักษารถโฟล์คลิฟท์ประจำวันจึงสำคัญ